


Throughout the coronavirus crisis, the public has been overwhelmed by new statistics from countries across the world.
Data journalists have stepped in to turn these mind-boggling and, often seemingly meaningless, figures into digestible information for their readers and viewers.
Here, Press Gazette showcases some of the best data journalism to come out of the Covid-19 crisis so far.
If there is some excellent journalism you have spotted which we have missed, please submit it for consideration in the second round of judging.
Related


Other Coronavirus Journalism Excellence categories:
- exclusive news coverage
- investigations
- breaking news and live blogs
- podcasts
- editorial innovations
- comment/opinion
- video/TV.
Best data journalism of the coronavirus pandemic
Financial Times: Coronavirus Tracked
FT Data Team
Coronavirus Tracked, which uses a variety of graphics to help tell the story of Covid-19, is the FT’s most read story of all time (made free beyond the paywall). Its submission said: “Data journalism has been a vital part of the FT’s approach to reporting for a long time, with dedicated data journalists offering insights on anything from Brexit to climate change, so when the pandemic struck the FT’s data driven approach was exactly what millions of readers were looking for.”
Content from our partners


Medium: Coronavirus: Why You Must Act Now
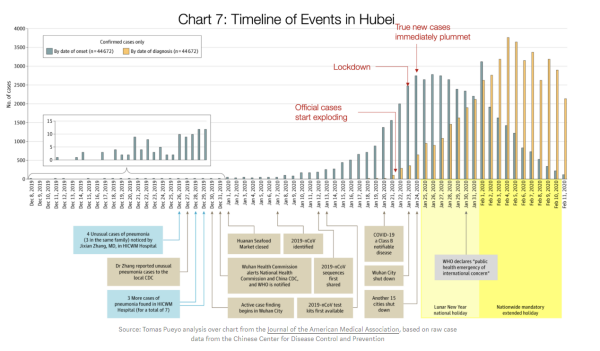
Tomas Pueyo
Based around a series of charts on newly-emerging data on 10 March, this lengthy article set out the case for lockdowns and other urgent action that governments should be taking across the world. Viewed more than 40m times in a week, Medium has translated it into various languages and the piece has been shared or endorsed by a number of epidemiologists and experts. The judges said it was “very insightful”.
The Economist: Covid-19 is now in 50 countries, and things will get worse
Rosamund Pearce
The small diagram (below) by Rosamund Pearce was published by The Economist in late February, before many had grasped the signficance of the phrase “flatten the curve”. The Economist’s submission noted that the graphic “contained no numbers, but its simple message immediately resonated around the world. It was subsequently recreated in multiple languages, helped popularise the #FlattenTheCurve hashtag and has even been credited with saving thousands of lives.”

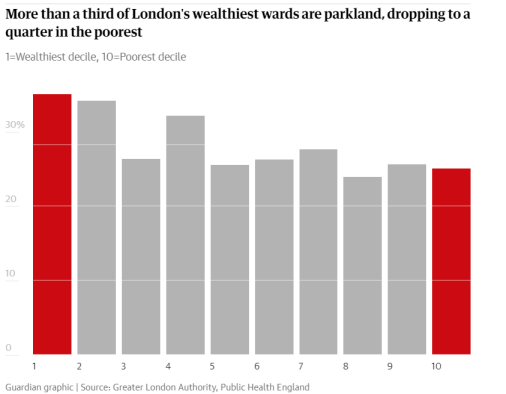
The Guardian: Coronavirus park closures hit BAME and poor Londoners most
Guardian Data Projects Team
The Guardian used publicly-available datasets to investigate inequality in green space access across the UK. The team said: “By matching data on private garden space, deprivation, and ethnicity, we were able to show that deprived and BAME Londoners had much less access to gardens on average and would be disproportionately affected if there were further park closures. Many of our readers felt this was a valuable contribution to the public debate around the role of parks in a pandemic and it was widely read and shared.”
The Economist: Tourism flows and death rates suggest covid-19 is being under-reported
Sondre Solstad and Matt McLean
The Economist said this article, from early March, was one of the first to quantify the extent to which Covid-19 was being under-reported by countries across the world. The publication used tourism flows to and from China to estimate the true size of each country’s outbreak. The judges described this as an “excellent analysis using multiple data sets – real data journalism”.
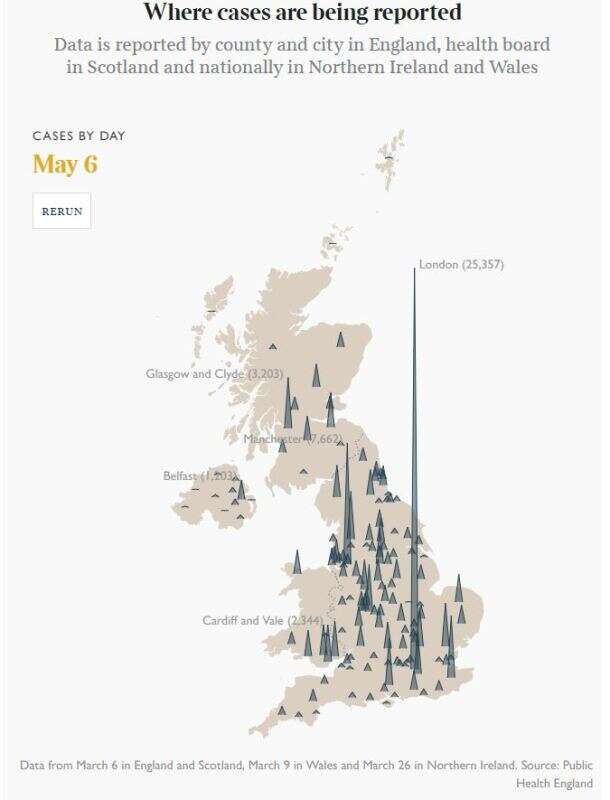
The Times/ Sunday Times: Coronavirus tracker map UK
The Times & The Sunday Times data and digital storytelling team
The Times/ Sunday Times tracker map has attracted more page views and unique visitors than any other article on their website this year. The page features visuals, graphics and interactives on the latest number of coronavirus cases and deaths across the UK. Its submission said: “This article brings together the journalistic rigour, skills and expertise of the team to produce an outstanding piece of data and visual journalism and at a time of crisis allows readers understand the complex data and numbers that underpin the pandemic.”
South China Morning Post: Coronavirus: the disease Covid-19 explained
SCMP Infographics Team
First published on 21 January, when most the world considered Covid-19 to be an issue for China and Asia, this page features a series of graphics to explain the disease and its outbreak. The judges praised the piece’s “superb graphics”, which “help take the story to deeper levels”.
The Ferret: NHS struggled to recruit senior anaesthetists before coronavirus
Joe Lo
In late March, the Ferret explored recent Scottish government figures and found that many health boards had struggled to recruit enough consultant anaesthetists, raising concerns about care being received by coronavirus patients. The judges said the story took a “novel angle” that was “intelligently analysed”.
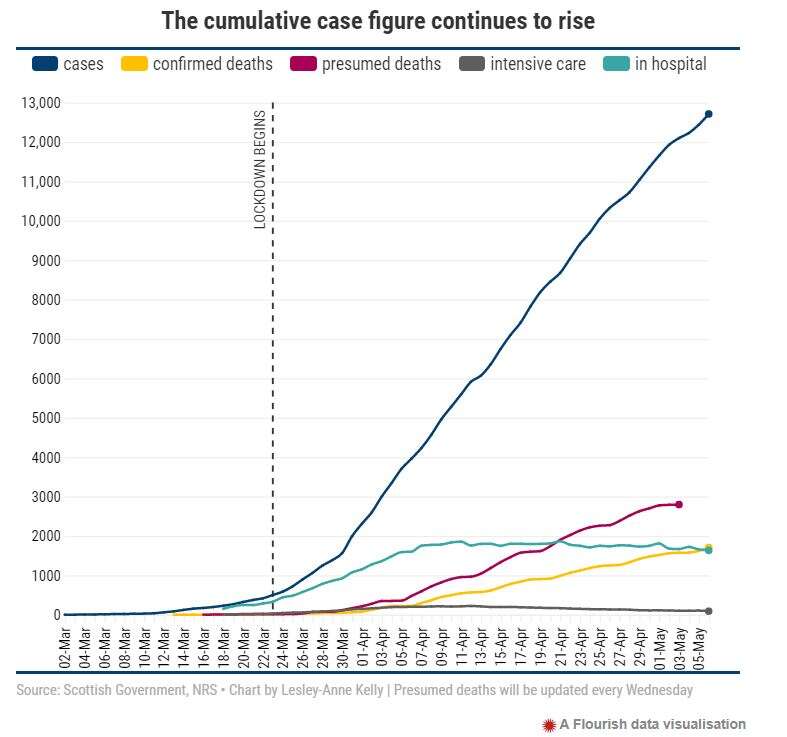
The Courier: Coronavirus in Scotland – track the spread in these charts and maps
Lesley-Anne Kelly
These graphics by data analyst Lesley-Anne Kelly provided readers of the Courier and Press & Journal “with a unique and comprehensive overview of the real impact of the Covid-19 pandemic on Scotland and our distinct circulation areas”. First published on 18 March, the datasets have been regularly updated as official figures have been released. One reader, James Peters, wrote in to the newspaper to praise the work. He said: “As a chartered engineer with both the mathematical and statistical knowledge to produce my own analysis of the data, which I currently do, I find the charts and maps to be excellent and, in my lowly opinion, provide the best overview of the state of play in Scotland.”
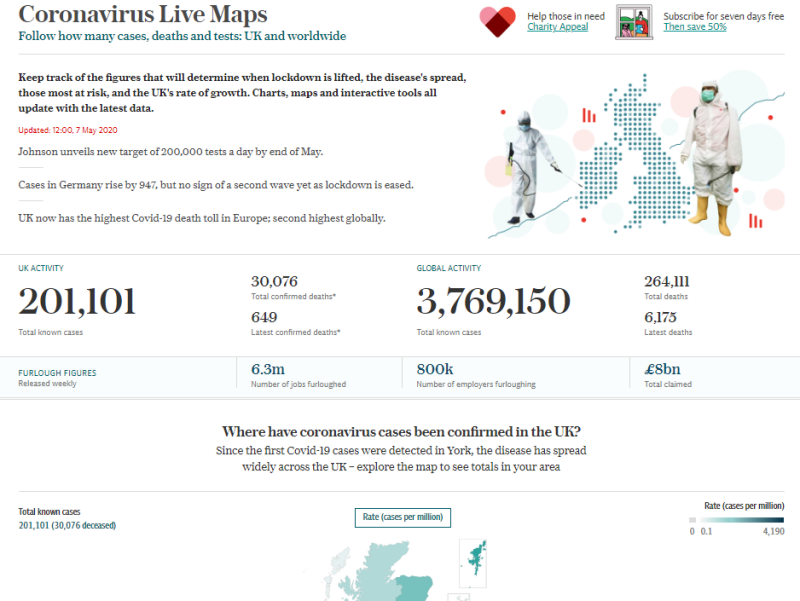
Telegraph coronavirus live tracker
The title said in its submission: “The Telegraph’s Coronavirus Live Tracker is a dashboard of data and analysis with key metrics that explain how the UK has responded to the pandemic compared to other countries, and the effect those actions have had on the spread of the disease. Readers can follow how many cases, deaths and tests there are in the UK and worldwide, enter their postcode for a breakdown for their local area, track the disease’s spread, get the latest symptoms, and gain valuable context by comparing the impact of Covid-19 with other diseases. All charts, maps and interactive tools update live with the latest data and can be embedded directly into stories too, giving journalists useful, real time data visualisation to support their report and better explain it to readers.”
Email pged@pressgazette.co.uk to point out mistakes, provide story tips or send in a letter for publication on our "Letters Page" blog